

Mastering SaaS Metrics: The Key to Unlocking Growth
In the dynamic world of Software as a Service (SaaS), tracking the right metrics is crucial for sustainable growth and success. SaaS metrics provide valuable insights into customer acquisition, retention, and revenue generation, enabling businesses to make data-driven decisions and optimize their strategies. This comprehensive guide will explore the importance of SaaS metrics, the key metrics to monitor, and best practices for effective analysis and reporting.
What are SaaS Metrics?
SaaS metrics are quantitative measures that help SaaS businesses evaluate their performance, customer behavior, and overall health. These metrics provide a holistic business view, enabling informed decision-making and strategic planning.
Importance of SaaS Metrics
SaaS metrics play a vital role in understanding and optimizing various aspects of a business, including:
Customer Acquisition:
Customer Acquisition Cost (CAC):
This metric measures the cost of acquiring a new customer, including marketing, sales, and advertising expenses. By tracking CAC, businesses can evaluate the efficiency of their acquisition strategies and optimize their marketing spend to acquire customers more cost-effectively.
Conversion Rate:
Conversion Rate measures the percentage of leads or prospects that convert into paying customers. A high conversion rate indicates the effectiveness of sales and marketing efforts in converting leads, while a low rate may signify areas for improvement in lead nurturing and sales processes.
Customer Retention:
Churn Rate:
Churn Rate calculates the percentage of customers who cancel or unsubscribe from a service within a specific period. Monitoring the churn rate is crucial for assessing customer loyalty and identifying potential issues that may lead to customer dissatisfaction.
Customer Lifetime Value (CLV):
CLV represents the total revenue a customer generates over the entire duration of their relationship with the business. Understanding CLV helps businesses determine the long-term profitability of acquiring and retaining customers, guiding decisions related to customer acquisition costs and retention strategies.
Revenue Generation:
Monthly Recurring Revenue (MRR) and Annual Recurring Revenue (ARR):
MRR and ARR track the predictable, recurring revenue generated from subscription fees on a monthly or annual basis. These metrics provide visibility into revenue streams, growth trends, and the overall health of the subscription business model.
Average Revenue Per User (ARPU):
ARPU calculates the average revenue generated per user or customer. It helps businesses assess pricing strategies, identify opportunities for upselling or cross-selling, and evaluate the overall revenue potential of their customer base.
Product Usage:
Adoption Rate:
Adoption Rate measures the percentage of users actively using or adopting a product within a given time frame. It indicates the level of acceptance and satisfaction with the product among users.
Engagement Metrics:
Metrics such as user engagement, session duration, and feature usage provide insights into how customers interact with the product. Analyzing these metrics helps prioritize product improvements, identify popular features, and optimize the user experience to increase engagement and satisfaction.
Strategies for Improving SaaS Metrics
Improving SaaS metrics requires a holistic approach that addresses various aspects of the business, including:
Optimizing Customer Acquisition:
Refine Marketing Strategies:
Analyze the effectiveness of various marketing channels and campaigns to allocate resources to the most cost-effective channels—experiment with different messaging, targeting techniques, and creative assets to optimize conversion rates.
Improve Lead Nurturing Processes:
Implement automated email sequences, personalized content, and targeted messaging to nurture leads throughout the sales funnel. Provide valuable resources and educational content to address prospects’ pain points and build trust.
Streamline Onboarding Experiences:
Simplify the onboarding process to help new customers get started quickly and experience the product’s value sooner. Provide guided tours, tutorials, and proactive support to ensure a smooth transition from sign-up to activation.
Enhancing Customer Retention:
Implement Effective Customer Success Programs:
Develop proactive customer success strategies to maximize customer satisfaction and minimize churn. Assign dedicated account managers or customer success representatives to provide personalized support and guidance.
Gather Feedback:
Solicit feedback from customers regularly through surveys, feedback forms, and customer advisory boards. Use this feedback to identify pain points, address issues, and prioritize product improvements that enhance customer satisfaction.
Continuously Improve the Product Based on User Insights:
Leverage usage data, user feedback, and customer behavior analytics to identify opportunities for product enhancement. Prioritize feature development and product updates that align with customer needs and preferences.
Increasing Revenue Generation:
Explore Pricing Strategies:
Conduct pricing experiments to optimize pricing tiers, packaging, and billing options. Consider value-based pricing models, tiered pricing structures, and discounts or promotions to maximize revenue while maintaining customer satisfaction.
Upselling Opportunities:
Identify opportunities to upsell existing customers on premium features, additional services, or higher-tier subscription plans. Offer personalized recommendations based on usage patterns, user behavior, and customer needs.
Explore New Revenue Streams:
Diversify revenue streams by offering complementary products, add-ons, or premium content/services. Explore partnerships, white-labeling opportunities, or licensing agreements to expand the product offering and reach new markets.
Boosting Product Usage:
Improve User Experience:
Continuously optimize the user interface, navigation, and overall user experience to make the product intuitive and easy to use. Gather user feedback and conduct usability testing to identify areas for improvement.
Offer Training and Support Resources:
Provide comprehensive training materials, documentation, and support resources to help users maximize the product’s value. Offer live training sessions, webinars, and self-paced learning modules to cater to different learning preferences.
Leverage Gamification Techniques:
Introduce gamification elements such as badges, achievements, and progress tracking to incentivize user engagement and promote product adoption. Create interactive experiences, challenges, and rewards to encourage users to explore and interact with the product actively.
Types of SaaS metrics
Financial Metrics:
Customer Acquisition Cost (CAC):
This metric evaluates the cost of acquiring a new customer, including sales and marketing expenses. It’s essential to assess the efficiency of your customer acquisition strategies and ensure that the cost of acquiring a customer is, at most, the revenue they generate.
Customer Lifetime Value (CLTV or LTV):
CLTV predicts a customer’s total revenue throughout their relationship with your business. By comparing CLTV with CAC, you can determine the long-term profitability of acquired customers and allocate resources effectively to maximize returns.
Monthly Recurring Revenue (MRR):
MRR represents the predictable and recurring revenue generated from subscription-based customers each month. Tracking MRR is crucial for forecasting revenue, evaluating growth trends, and assessing the health of your subscription business model.
Annual Recurring Revenue (ARR):
ARR calculates the total revenue expected from subscription-based customers annually. Compared to MRR, it provides a broader view of revenue and helps in long-term planning and assessing business performance.
Customer Success Metrics:
Churn Rate:
The churn rate measures the percentage of customers who stop using your service within a specific period of time. Monitoring the churn rate is critical for assessing customer satisfaction and identifying areas for improvement in your product or service.
Customer Retention Rate:
Customer retention rate measures the percentage of customers retained over a specific period. High retention rates indicate customer satisfaction and loyalty, while low rates may signal issues with product quality or customer experience.
Expansion Revenue:
Expansion revenue is the additional revenue from existing customers through upsells, cross-sells, or upgrades. It’s essential for maximizing customer lifetime value and increasing overall revenue without solely relying on acquiring new customers.
Average Revenue Per User (ARPU):
ARPU calculates the average revenue generated per user or customer within a specific period. It provides insights into the revenue-generating potential of individual customers and segments.
Operational Metrics:
Active Users/Customers:
Active users or customers represent the number of individuals or organizations actively using your SaaS product within a given timeframe. Monitoring active users helps evaluate product engagement and identify trends in usage patterns.
Usage Metrics:
These metrics track how customers interact with your product, such as feature adoption rates, session duration, and frequency of use. Understanding usage patterns helps in improving product design and identifying areas for enhancement.
Support Metrics:
Support metrics measure the efficiency and effectiveness of customer support operations, including response time, resolution rate, and customer satisfaction scores. Improving support metrics leads to higher customer satisfaction and retention.
Product Performance Metrics:
Product performance metrics evaluate the reliability and performance of your SaaS platform, including uptime, latency, and error rates. Monitoring these metrics ensures a seamless user experience and helps promptly identify promptly and resolve technical issues.d Marketing Metrics:
Lead Conversion Rate:
Lead conversion rate measures the percentage of leads that convert into paying customers. It helps evaluate the effectiveness of your sales and marketing funnel and optimize conversion strategies.
Sales Velocity:
Sales velocity calculates the speed at which deals move through the sales pipeline, from initial contact to closing. It provides insights into sales efficiency and helps forecast revenue and resource allocation.
Cost per Lead (CPL):
CPL measures the cost of acquiring a lead through marketing efforts. It helps in assessing the efficiency of marketing campaigns and optimizing budget allocation for lead generation.
Marketing Qualified Leads (MQLs) and Sales Qualified Leads (SQLs):
MQLs and SQLs are leads deemed more likely to convert into paying customers based on predefined criteria. Tracking these metrics helps prioritize leads and align sales and marketing efforts.
Product Metrics:
Feature Adoption Rate:
Feature adoption rate measures the percentage of users who actively use specific features or functionalities of your product. It helps identify popular features and prioritize development efforts.
User Engagement Metrics:
User engagement metrics track how users interact with your product, including logins, clicks, and time spent. Improving user engagement leads to higher customer satisfaction and retention.
Product Usage Metrics:
These metrics quantify how customers use your product, such as the number of documents created, API calls, or data processed. Understanding usage patterns helps in optimizing product offerings and identifying opportunities for upselling or cross-selling.
Customer Satisfaction Score (CSAT) or Net Promoter Score (NPS):
CSAT and NPS measure customer satisfaction and loyalty based on feedback surveys. They provide valuable insights into customer sentiment and help prioritize product improvements and customer support initiatives.
Retention Metrics:
Renewal Rate:
The renewal rate measures the percentage of customers who renew their subscriptions at the end of their contract period. It reflects customer satisfaction and loyalty and is crucial for maintaining a healthy subscription business.
Upgrade Rate:
Upgrade rate tracks the percentage of customers who upgrade to higher-tier subscription plans or purchase additional features or services. Increasing upgrade rates contributes to higher revenue and customer lifetime value.
Downgrade Rate:
The downgrade rate measures the percentage of customers who switch to lower-tier subscription plans or reduce their usage of features or services. Monitoring downgrade rates helps identify factors affecting customer satisfaction and retention.
Expansion Revenue: As mentioned earlier, expansion revenue refers to the additional revenue generated from existing customers through upsells, cross-sells, or upgrades. It’s a key driver of growth and profitability in subscription-based businesses.
Market Metrics:
Market Share:
These represents your company’s portion of the total market for your product or service. Tracking market share helps assess competitive positioning and identify growth opportunities.
Competitive Positioning Metrics:
These metrics evaluate how your product or service compares to competitors regarding features, pricing, customer satisfaction, and market presence. Understanding competitive positioning helps in developing effective differentiation strategies.
Total Addressable Market (TAM) and Serviceable Addressable Market (SAM):
TAM represents the total market demand for your product or service, while SAM represents the portion of TAM that your business can realistically target. Assessing TAM and SAM helps size the market opportunity and set growth targets.
Operational Efficiency Metrics:
Cost per User (CPU):
CPU measures the average cost of acquiring and serving each user or customer. Optimizing CPU helps in improving profitability and resource allocation.
Customer Support Efficiency:
This metric evaluates the efficiency of customer support operations, including the number of tickets resolved per hour, average response time, and customer satisfaction scores. Improving support efficiency leads to higher customer satisfaction and retention.
Infrastructure Costs as a Percentage of Revenue:
This metric measures the proportion of revenue spent on infrastructure and hosting services. Monitoring infrastructure costs helps optimize resource utilization and control expenses.
Common Challenges in SaaS Metrics Analysis
Analyzing SaaS metrics is essential for understanding the health and performance of a subscription-based business. However, several common challenges may arise during the process:
Data Accuracy and Consistency:
Ensuring the accuracy and consistency of data across different systems, platforms, and data sources can be challenging. Discrepancies or inconsistencies in data collection, integration, or reporting may lead to misleading insights and flawed decision-making.
Data Volume and Complexity:
SaaS businesses generate vast amounts of data from various sources, including user interactions, transactions, and system logs. Managing and analyzing large volumes of data can be complex and resource-intensive, requiring robust data infrastructure, analytics tools, and expertise.
Metrics Selection and Interpretation:
Given the multitude of metrics available, choosing the right metrics to track and interpret can be daunting. Stakeholders may prioritize different metrics based on their roles, objectives, and perspectives, leading to confusion or conflicting priorities.
Time Lag and Lagging Indicators:
SaaS metrics, such as churn rate or customer lifetime value, must catch up on indicators that reflect past performance rather than real-time insights. Analyzing these metrics may involve a time lag, making it challenging to identify trends or respond proactively to changes in the market or customer behavior.
Context and Attribution:
Understanding the context behind the data and attributing causality to observed changes or trends can be challenging. External factors like market dynamics, competitive landscape, or macroeconomic conditions may influence SaaS metrics, complicating the analysis and interpretation process.
Data Privacy and Compliance:
Ensuring compliance with data privacy regulations, such as GDPR or CCPA, while collecting, storing, and analyzing customer data is critical. Adhering to data privacy best practices and implementing robust security measures is essential to protect sensitive customer information and maintain trust.
Cross-Functional Collaboration:
Analyzing SaaS metrics often requires collaboration across different departments and functions, including product management, marketing, sales, finance, and customer success. Aligning stakeholders, coordinating efforts, and breaking down silos can be challenging but essential for holistic analysis and decision-making.
Benchmarking and Industry Standards:
Benchmarking SaaS metrics against industry standards or peers can be challenging due to variations in business models, customer segments, and market dynamics. Identifying relevant benchmarks and comparing performance accurately requires access to benchmarking data and industry insights.
Best Practices for SaaS Metrics Reporting
Effective reporting is crucial for communicating insights and driving data-driven decision-making. Best practices include:
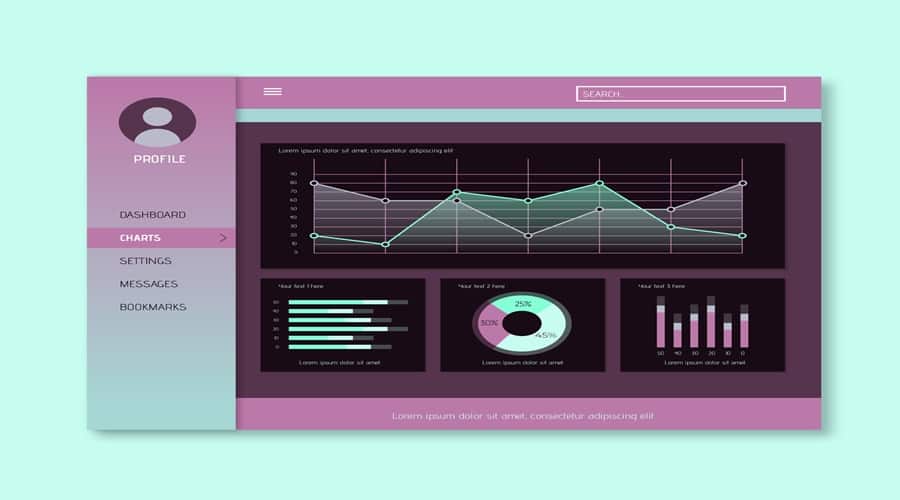
Customized Dashboards:
Develop customized dashboards that cater to stakeholders’ specific needs and preferences, such as executives, product managers, marketers, and sales teams.
Ensure that each dashboard provides real-time visibility into key metrics relevant to the stakeholder’s role and objectives using intuitive visualizations and interactive charts.
Include drill-down capabilities and filters to allow users to explore data more detail and customize views based on their preferences.
Trend Analysis:
Conduct trend analysis by analyzing SaaS metrics to identify patterns, trends, and anomalies. Track key performance indicators (KPIs) regularly to monitor progress and detect changes in performance.
Use trend analysis to forecast future performance, set benchmarks, and establish performance targets. Identify areas of improvement and potential risks early to take proactive actions and mitigate negative impacts.
Benchmarking:
Benchmark SaaS metrics against industry standards, best practices, and competitors to gauge performance and identify areas for improvement.
Use benchmarking data to set performance targets, assess relative performance, and prioritize areas for optimization. Compare churn rate, customer acquisition cost (CAC), and customer lifetime value (CLV) against industry benchmarks to understand your business’s performance.
Segmentation and Cohort Analysis:
Segment SaaS metrics by customer segments, subscription plans, geographic regions, or other relevant dimensions to gain deeper insights into performance drivers and customer behavior.
We conducted cohort analysis to track the behavior of customers’ cohorts over time, such as cohorts based on signup date or product usage milestones. Analyze retention, churn, and revenue metrics for different cohorts to understand how changes in the customer base impact overall performance.
Actionable Insights and Recommendations:
Provide actionable insights and recommendations based on SaaS metrics analysis to drive data-driven decision-making and business growth.
Translate data into actionable insights by identifying opportunities for optimization, recommending strategic initiatives, and highlighting areas of concern or risk.
Collaborate with stakeholders to develop action plans, prioritize initiatives, and track the impact of interventions on key metrics over time.
SaaS Metrics Benchmarks and Industry Standards
While specific benchmarks may vary across industries and business models, some general industry standards can serve as reference points:
Customer Acquisition Cost (CAC) Ratio:
Calculate the CAC Ratio by dividing the Customer Acquisition Cost (CAC) by the Average Revenue Per User (ARPU). A CAC Ratio below 1 is generally considered healthy, indicating that the cost of acquiring a customer is lower than the revenue generated from that customer over a given period.
For B2B SaaS businesses, a CAC Ratio of 0.6 to 0.9 is often considered optimal, reflecting a balance between acquisition costs and revenue generation.
Churn Rate:
Churn Rate measures the percentage of customers who cancel or unsubscribe from a service within a specific period, typically annually. A churn rate below 5-7% annually is generally acceptable for SaaS businesses, although benchmarks may vary depending on factors such as industry, pricing model, and customer segment.
A lower churn rate may be desirable for early-stage startups or high-growth companies, as it indicates strong customer retention and revenue stability.
Customer Lifetime Value (CLV) to CAC Ratio:
Calculate the CLV to CAC Ratio by dividing the Customer Lifetime Value (CLV) by the Customer Acquisition Cost (CAC). A CLV/CAC ratio of 3 or higher is often seen as a good target, indicating that the lifetime value of a customer exceeds the cost of acquiring that customer.
A higher CLV to CAC ratio suggests a strong return on investment (ROI) from customer acquisition efforts. It indicates that the business effectively monetizes its customer base over the long term.
Monthly Recurring Revenue (MRR) Growth Rate:
MRR Growth Rate measures the percentage increase or decrease in Monthly Recurring Revenue (MRR) over a specific period, typically monthly or quarterly. A healthy MRR growth rate depends on factors such as the stage of the business, market conditions, and growth targets.
For early-stage startups or high-growth companies, a minimum MRR growth rate of 10-20% per month is often considered a benchmark for sustainable growth and scalability.
Expansion Revenue and Net Dollar Retention:
Expansion Revenue measures the additional revenue generated from existing customers through upselling, cross-selling, or usage expansion. Aim for an Expansion Revenue rate of at least 100% to indicate that existing customers contribute to overall revenue growth.
Net Dollar Retention calculates the change in revenue from existing customers over a specific period, accounting for churn, contraction, and expansion. A Net Dollar Retention rate above 100% indicates negative churn, where revenue from existing customers exceeds lost revenue from churned customers.
Advanced SaaS Metrics for Growth Optimization
As businesses mature, they may consider tracking advanced metrics for further growth optimization, such as:
Net Revenue Retention (NRR):
Net Revenue Retention measures the change in revenue from existing customers over a specific period, accounting for expansion (upsells, cross-sells), contraction (downgrades, cancellations), and churn.
A positive NRR indicates that the revenue generated from existing customers exceeds lost revenue from churned or downgraded customers, contributing to overall revenue growth.
NRR provides valuable insights into the effectiveness of upselling, cross-selling, and retention efforts. It allows businesses to identify opportunities for revenue expansion and maximize customer lifetime value (CLV).
Customer Engagement Scoring:
Customer Engagement Scoring quantifies the level of engagement and interaction between customers and the SaaS product or service.
By tracking user activities, feature usage, and behavioral metrics, businesses can assign customer scores based on their level of engagement, ranging from inactive to highly engaged.
Customer Engagement Scoring helps identify at-risk customers, prioritize outreach and support efforts, and personalize engagement strategies to drive user adoption, retention, and satisfaction.
Feature Adoption Metrics:
Feature Adoption Metrics track the usage and adoption of specific features or functionalities within the SaaS product.
By analyzing feature adoption rates, usage patterns, and user feedback, businesses can assess the effectiveness of product features, identify popular features, and prioritize development efforts.
Feature Adoption Metrics help inform product roadmap decisions, optimize user experience, and drive product-led growth by focusing on features that deliver the most value to customers.
Product-Led Growth (PLG) Metrics:
Product-led growth (PLG) Metrics quantify the effectiveness of product-led strategies in driving user acquisition, activation, and expansion.
Key PLG Metrics include Activation Rate, Virality Coefficient, and Expansion Revenue, which measure the rate at which users activate, refer others, and expand their usage or upgrade their subscriptions.
PLG Metrics emphasizes the importance of delivering value through the product experience, empowering users to self-serve, and leveraging product virality and network effects to drive organic growth.
Future Trends in SaaS Metrics
The SaaS landscape is constantly evolving, and new trends are emerging that may impact metric tracking and analysis:
Product-Led Growth (PLG):
With the rise of PLG, product usage, and feature adoption metrics will become increasingly important.
Customer Success:
As customer success becomes a core focus, customer health, satisfaction, and advocacy metrics will gain prominence.
Artificial Intelligence (AI) and Machine Learning (ML):
AI and ML technologies will enable more advanced predictive analytics and data-driven decision-making.
FAQs
What is the difference between MRR and ARR?
MRR (Monthly Recurring Revenue) represents the recurring revenue generated from subscriptions within a month. At the same time, ARR (Annual Recurring Revenue) is the annualized version of MRR, providing a broader view of the recurring revenue stream.
How is Customer Acquisition Cost (CAC) calculated?
CAC is typically calculated by dividing the total costs of acquiring new customers (e.g., marketing, sales, and onboarding expenses) by the number of new customers acquired within a specific period.
What is a good Churn Rate for a SaaS business?
While there is no universally accepted “good” Churn Rate, a rate below 5-7% annually is generally acceptable for most SaaS businesses. However, the acceptable Churn Rate may vary based on the industry, business model, and maturity stage.
Why is Customer Lifetime Value (CLV) important?
CLV is a crucial metric as it represents the projected revenue a customer will generate during their lifetime with the company. A high CLV indicates customer loyalty and profitability, making it a key factor in determining the long-term sustainability of a SaaS business.
What are Product-Led Growth (PLG) Metrics?
PLG Metrics measures and optimizes product experience, user adoption, and feature usage. Examples include activation rate, feature adoption rate, and user engagement metrics.
How can AI and ML improve SaaS Metrics analysis?
AI and ML technologies can enhance SaaS Metrics analysis by enabling predictive modeling, automated anomaly detection, and personalized recommendations based on customer behavior and usage patterns.
Conclusion
In the fast-paced SaaS industry, tracking and analyzing the right metrics is essential for sustainable growth and success. Businesses can make informed decisions, improve customer acquisition and retention, and drive revenue by understanding and optimizing key metrics like MRR, CAC, CLV, and Churn Rate. Embracing best practices for reporting and benchmarking while staying ahead of emerging trends will enable SaaS companies to navigate the competitive landscape and achieve long-term success.
Recent Posts

7 Best Call Automation Tools for SaaS Growth in 2025

Mastering SaaS SEO: Unlocking Organic Growth for Business